

Image Details
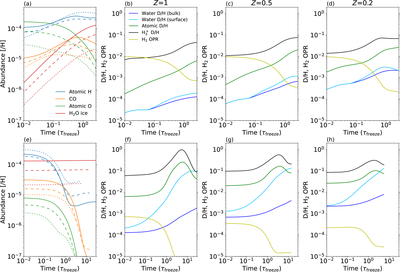
Caption: Figure 1.
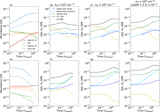
Temporal evolution of selected species and D/H ratios during the cloud (top panels) and core stages (lower panels). Panels (a) and (e) show the abundances of selected species during the cloud and core stages, respectively. Solid, dashed, and dotted lines denote models with Z = 1, 0.5, and 0.2, respectively. The remaining panels show the temporal evolution of the D/H ratios and the H2 OPR for Z = 1 (b), (f), Z = 0.5 (c), (g), and Z = 0.2 (d), (h). In all panels, time is normalized by τfreeze for the corresponding density and metallicity.
Other Images in This Article
Copyright and Terms & Conditions
© 2026. The Author(s). Published by the American Astronomical Society.

Copyright ©
2026 Astronomy Image Explorer. All Rights Reserved.
