

Image Details
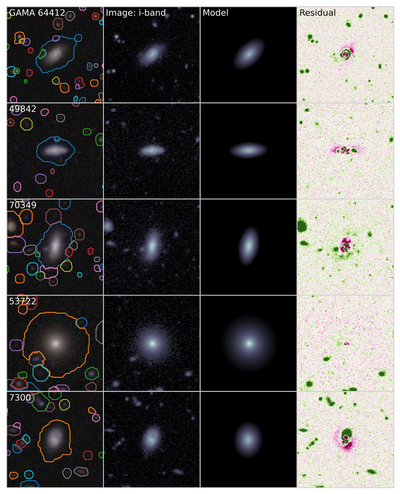
Caption: Figure A2.
Examples of faint HSC galaxies and their structural modeling. Columns left to right: (a) HSC gri color composites, including masks for foreground and background sources. (b) HSC i-band images used for the structural analysis. (c) Best-fitting i-band structural models. (d) Residual images obtained by subtracting the models from the data. Residual color scales span −5 to +5 times the average sky noise, where purple indicates oversubtracted regions and green indicates undersubtracted regions. The images are displayed at three times the scale used for source detection and deblending for clarity.
Other Images in This Article
Show More
Copyright and Terms & Conditions
© 2026. The Author(s). Published by the American Astronomical Society.

