

Image Details
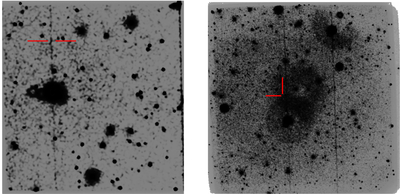
Caption: Figure B1.
Left: optical image of the field, obtained by stacking the UVOT u, b, and v observations in segment 000. The red lines mark the GRB position affected by a read-out streak from the nearby star. Right: UV image of the field, obtained by stacking the UVOT w1 observations in segment 001. The red lines mark the GRB position, falling within rings of scattered light. The colormaps are scaled using the histogram equalization function in ds9.
Other Images in This Article
Copyright and Terms & Conditions
© 2026. The Author(s). Published by the American Astronomical Society.

Copyright ©
2026 Astronomy Image Explorer. All Rights Reserved.
