

Image Details
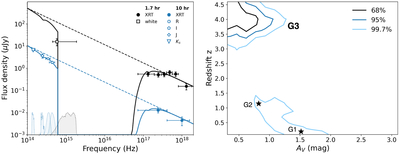
Caption: Figure 2.
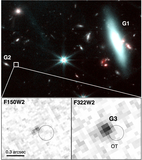
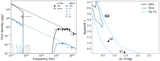
Left: broadband afterglow SED at T0 + 1.7 hr and T0 + 10 hr. X-ray data (filled circles) and optical/NIR photometric points (open symbols) are best fit by a power-law model with index β ≈ 0.8, shown by the dashed line (without absorption/extinction) and by the solid line (including absorption and extinction effects). The dotted shaded curves show the filter response functions. Right: confidence contours for intrinsic extinction AV and redshift z. Contours show the 68%, 95%, and 99.7% confidence regions. The preferred model corresponds to a high-redshift origin, consistent with an association with G3. The stars indicate the best-fit values for G1 and G2.
Other Images in This Article
Copyright and Terms & Conditions
© 2026. The Author(s). Published by the American Astronomical Society.

