

Image Details
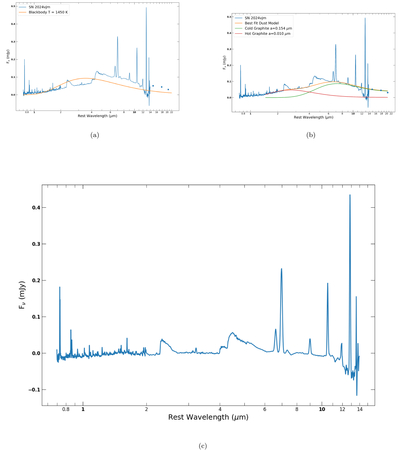
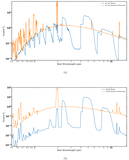
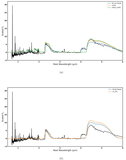
Caption: Figure 6.
(a) The observed Day +196.1 SN 2024vjm JWST spectrum plotted against the best-fit blackbody. (b) The observed Day +196.1 SN 2024vjm JWST spectrum plotted against the best-fit dust model. The two components of the model, consisting of cold, 0.15 μm and hot, 0.01 μm graphite, are also shown. (c) The observed Day +196.1 SN 2024vjm JWST spectrum with the best fit dust model (b) removed.
Other Images in This Article
Copyright and Terms & Conditions
© 2026. The Author(s). Published by the American Astronomical Society.

Copyright ©
2026 Astronomy Image Explorer. All Rights Reserved.
