

Image Details
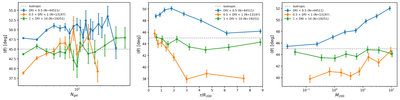
Caption: Figure 3.
Disentangling the primary drivers of the signal. Similar to Figure 2, but in each panel the sample is subdivided by projected distance to the nearest filament into three bins: Dfil < 0.5 h−1 Mpc (blue), 0.5 ≤ Dfil < 1.0 h−1 Mpc (orange), and 1.0 ≤ Dfil < 10.0 h−1 Mpc (green); the legend reports the number of systems in each bin. The gray dashed line marks the isotropic expectation (〈θ〉 = 45∘). Points show the binned mean values of the angle θ between the satellite orbital-normal vector ﹩{\hat{{\boldsymbol{n}}}}_{{\rm{orb}}}﹩ and the projected filament direction ﹩{\hat{{\boldsymbol{e}}}}_{{\rm{fil}}}﹩, and error bars indicate the 1σ uncertainty on the mean estimated from bootstrap resampling.
Other Images in This Article
Copyright and Terms & Conditions
© 2026. The Author(s). Published by the American Astronomical Society.

