

Image Details
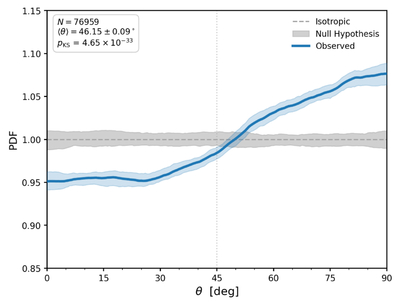
Caption: Figure 1.
Probability density distribution (PDF) of the alignment angle θ between the projected satellite orbital-normal vector ﹩{\hat{n}}_{{\rm{orb}}}﹩ and the local filament direction ﹩{\hat{e}}_{{\rm{fil}}}﹩. The blue solid line shows the kernel density estimation (KDE) of the observed θ distribution for the sample of 76,959 satellite systems. We use an Epanechnikov kernel with a bandwidth of 10∘ and apply boundary reflection at θ = 0∘ and 90∘. The blue shaded region represents the 1σ uncertainty estimated from 1000 bootstrap resamplings. The horizontal gray dashed line denotes the analytical expectation for an isotropic distribution. The gray shaded band indicates the 1σ null hypothesis range, generated from 1000 random realizations of the filament orientations. The vertical dotted line marks the θ = 45∘ isotropic midpoint. Statistics including the mean alignment angle 〈θ〉 ± σ〈θ〉 and the Kolmogorov–Smirnov (KS) test p-value against a uniform distribution are shown in the legend.
Other Images in This Article
Copyright and Terms & Conditions
© 2026. The Author(s). Published by the American Astronomical Society.

