

Image Details
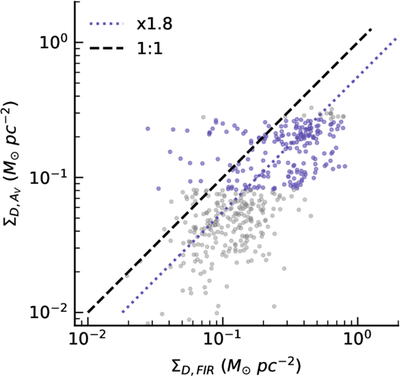
Caption: Figure 1.
Comparison of median dust-mass surface densities derived from FIR emission (ΣD, FIR) and extinction (﹩{{\rm{\Sigma }}}_{D,\,{A}_{V}}﹩) for all fields in the LMC. Each point represents one sight line with a resolution of 60″/15 pc (n = 510). Sight lines above (AV > 2.0 mag) or below (AV < 0.6 mag) the imposed quality cuts outlined in Section 2.4 are colored gray (n = 296) and are omitted from subsequent analysis. For visual guidance, we plot a 1:1 trend line (black dashed line) and a 1:1.8 trend line (dotted line), which depicts the average observed offset between extinction and emission in other galaxies.
Other Images in This Article
Copyright and Terms & Conditions
© 2026. The Author(s). Published by the American Astronomical Society.

