

Image Details
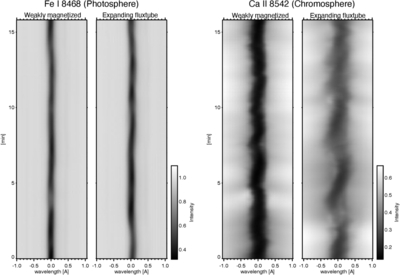
Caption: Figure 3.
λ–t diagrams of the photospheric Fe I 8468 Å and the chromospheric Ca II 8542 Å lines. In each pair, the left panel is at a weakly magnetized atmosphere (y = 50﹩\mathop{.}\limits^{{\unicode{x02033}}}﹩5), while the right panel is at the expanding fluxtube (y = 26﹩\mathop{.}\limits^{{\unicode{x02033}}}﹩7). The wavelength abscissae are provided relative to the mean of each spectral line. The gray color scales are shared between each pair.
Other Images in This Article
Copyright and Terms & Conditions
© 2026. The Author(s). Published by the American Astronomical Society.

Copyright ©
2026 Astronomy Image Explorer. All Rights Reserved.
