

Image Details
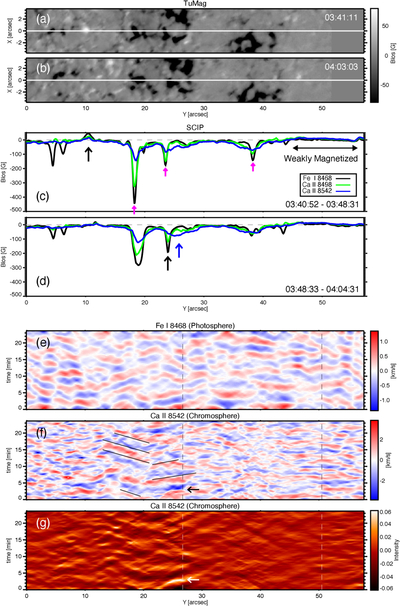
Caption: Figure 2.
Panel (a) and (b): two-dimensional distributions of the LOS magnetic field strength observed by TuMag at 03:41:11 and 04:03:03, respectively. The white horizontal line indicates the SCIP slit position. The uniform gray region on the right corresponds to areas not covered by the TuMag observations, where zero values are padded for display purposes. Panels (c) and (d): LOS magnetic field strength along the SCIP slit for the intervals 03:40:52–03:48:31 and 03:48:33–04:04:31, respectively. BFe I 8468, BCa II 8498, and BCa II 8542 are shown in black, green, and blue, respectively. The gray dashed line indicates 0 G. Panel (e) and (f): y–t diagrams of vFe I 8468 and vCa II 8542. Panel (g): y–t diagram of ICa II 8542. The quantities in panels (e)–(g) show components with phase speeds exceeding 7 km s−1. The two dashed lines in panels (e)–(g) indicate the locations from which the λ–t diagrams in Figure 3 were extracted.
Other Images in This Article
Copyright and Terms & Conditions
© 2026. The Author(s). Published by the American Astronomical Society.

