

Image Details
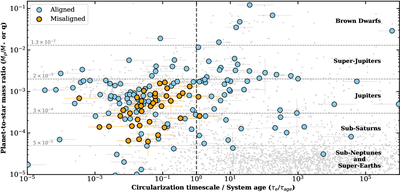
Caption: Figure 2.
The planet-to-star mass ratio q as a function of the eccentricity-damping timescale τe, normalized by the system age (τage). Blue and orange circles denote aligned and misaligned systems from the obliquity sample, respectively. Gray points show the broader exoplanet population from the PSCompPars table of NASA Exoplanet Archive (NASA Exoplanet Science Institute 2020; restricted to single stars with measured radii) and transiting brown dwarfs compiled from K. Barkaoui et al. (2025). The vertical black line marks τe = τage. Horizontal dashed lines delineate the mass-ratio boundaries between sub-Neptunes and super-Earths, sub-Saturns, Jupiters, super-Jupiters, and brown dwarfs. Systems to the left of the black line can be produced through high-eccentricity migration.
Other Images in This Article
Copyright and Terms & Conditions
© 2026. The Author(s). Published by the American Astronomical Society.

