

Image Details
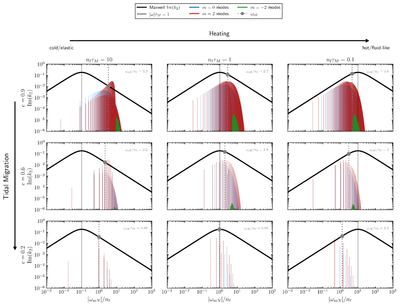
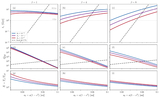
Caption: Figure 1.
Maxwell response and eccentric tidal forcing spectrum. The rows show decreasing eccentricity, corresponding to tidal migration along a constant angular momentum track; columns show decreasing nfτM, corresponding to heating and a shorter tidal relaxation time. Black curves show the Maxwell response ﹩{\rm{Im}}({k}_{2})﹩, and solid vertical black lines mark the Maxwell peak, ∣ω∣τM = 1. Colored vertical lines show the relative modal heating weights ﹩(| {\omega }_{mN}| /{n}_{{\rm{f}}}){{ \mathcal F }}_{mN}﹩ for m = 0, ±2, where ﹩{{ \mathcal F }}_{mN}=| {W}_{2m}{F}_{mN}{| }^{2}﹩. Frequencies are measured in the planetary rotating frame and normalized by the final circular mean motion nf. Gray dotted lines and circles mark the dissipation-weighted effective forcing frequency ωeff. At high eccentricity, the heating is produced by the overlap of many high-order harmonics with the viscoelastic response, rather than by a single forcing frequency.
Other Images in This Article
Copyright and Terms & Conditions
© 2026. The Author(s). Published by the American Astronomical Society.

