

Image Details
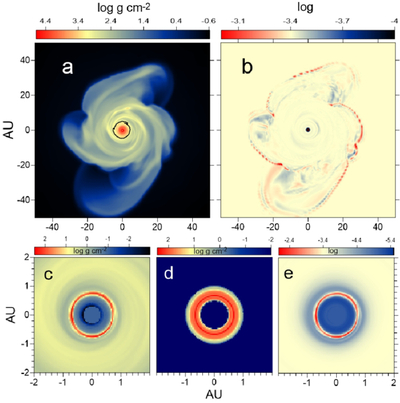
Caption: Figure 4.
Gas, dust, and planetesimal surface densities, alongside the dust-to-gas mass ratio ξd2g. Gas densities and ξd2g are shown 40 kyr after the formation of the protostar in (a) and (b), respectively, and (c)–(e) show the dust and planetesimal densities and ξd2g in the central 4 au of the disk, respectively. The black line marks the water snowline in (a). The initial ﹩{\mathrm{log}}{\xi }_{{\rm{d}}2{\rm{g}}}=-3.4﹩ is shown in yellow. A movie of the gas and dust densities in the disk as a function of time, together with the dust-to-gas mass ratio normalized to the initial value, can be viewed in the supplementary online material.
(An animation of this figure is available in the online article.)
(An animation of this figure is available.)
The video/animation of this figure is available in the online journal.
Other Images in This Article
Copyright and Terms & Conditions
© 2026. The Author(s). Published by the American Astronomical Society.

