

Image Details
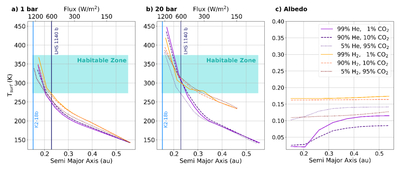
Caption: Figure 2.
Surface temperature (assuming an M dwarf spectrum and L = 0.0234LSun, resembling K2-18) as a function of semimajor axis (bottom x-axis) and incident flux at the planet (top x-axis), respectively. The blue-shaded area represents the region where liquid surface water is possible. The blue vertical lines indicate the received fluxes of K2-18b and LHS 1140 b, as reported by B. Benneke et al. (2019) and C. Cadieux et al. (2024), respectively. (a) Varying molar concentrations of CO2 (1%, 50%, 95%) with He and H2, respectively, as background gas with ps = 1 bar. (b) Varying molar concentrations of CO2 (1%, 50%, 95%) with He and H2, respectively, as background gas with ps = 20 bar. (c) Albedo as a function of semimajor axis for varying molar concentrations of CO2 (1%, 50%, 95%) with He and H2, respectively, as background gas with ps = 20 bar.
Other Images in This Article
Copyright and Terms & Conditions
© 2026. The Author(s). Published by the American Astronomical Society.

