

Image Details
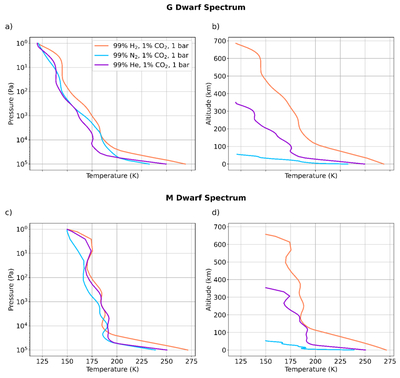
Caption: Figure 1.
Temperature profiles of atmospheres dominated by H2, N2, and He with 1% CO2 and ps = 1 bar with a stellar flux of 700 W m−2. Panel (a) shows temperature versus pressure while panel (b) shows temperature versus altitude, both for the solar spectrum. Panels (c) and (d) show the equivalent simulations assuming an M dwarf spectrum with TS = 3500 K.
Other Images in This Article
Copyright and Terms & Conditions
© 2026. The Author(s). Published by the American Astronomical Society.

Copyright ©
2026 Astronomy Image Explorer. All Rights Reserved.
