

Image Details
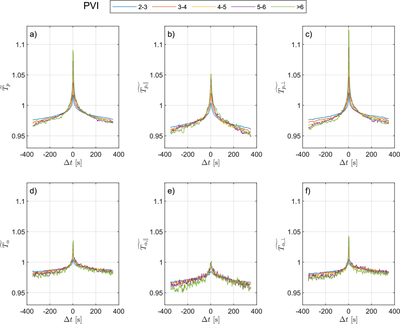
Caption: Figure 2.
Conditional median of the normalized temperature variations for protons (top row) and alpha particles (bottom row) under different PVI thresholds as defined by Equation (2). The different colored curves represent the results for five PVI threshold bins (2 ≤ PVI < 3, 3 ≤ PVI < 4, 4 ≤ PVI < 5, 5 ≤ PVI < 6, and PVI > 6). Panels (a)–(d) show results for the total (﹩\widetilde{{T}_{p}}﹩), parallel (﹩\widetilde{{T}_{p,\parallel }}﹩), and perpendicular (﹩\widetilde{{T}_{p,\perp }}﹩) temperature changes of protons, and panels (d)–(f) show the ﹩\widetilde{{T}_{\alpha }}﹩, ﹩\widetilde{{T}_{\alpha ,\parallel }}﹩, and ﹩\widetilde{{T}_{\alpha ,\perp }}﹩ for alphas.
Other Images in This Article
Copyright and Terms & Conditions
© 2026. The Author(s). Published by the American Astronomical Society.

