

Image Details
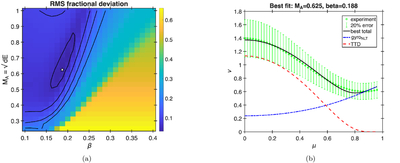
Caption: Figure 4.
(a) Contour map of rms fractional deviation of the fitting between the theoretical and experimental curves. The black isocontours mark the values from 5% to 20%. The ⋆ marks the point with the minimum rms deviation. (b) The best fitting with the corresponding parameters.
Other Images in This Article
Copyright and Terms & Conditions
© 2026. The Author(s). Published by the American Astronomical Society.

Copyright ©
2026 Astronomy Image Explorer. All Rights Reserved.
