

Image Details
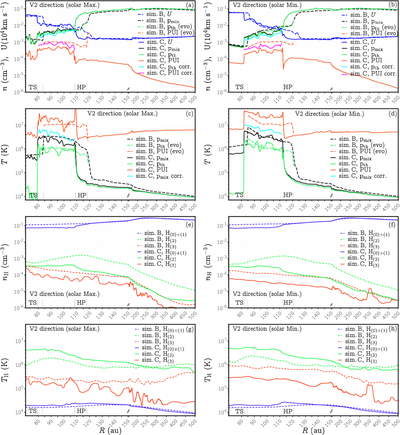
Caption: Figure 4.
Distributions of the plasma (panels (a)–(d)) and neutral H atom (panels (e)–(h)) variables in SW–LISM models B (dashed curves) and C (solid curves) along the V2 direction for two time snapshots corresponding to solar maximum (left panels) and solar minimum (right panels).
Other Images in This Article
Copyright and Terms & Conditions
© 2026. The Author(s). Published by the American Astronomical Society.

Copyright ©
2026 Astronomy Image Explorer. All Rights Reserved.
