

Image Details
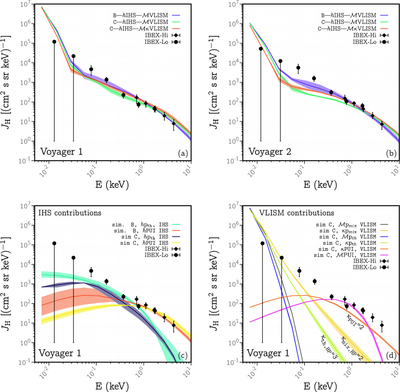
Caption: Figure 3.
ENA spectra calculated using the hybrid-based VDF model in the IHS. The top panels present the total fluxes obtained using simulations B and C. The bottom panels separate the contributions of the individual proton populations to the ENA flux, isolating the regional contributions from the IHS (left panels) and from the VLISM (right panels). In the right panel, the flux contribution from the same population is shown for several alternative VDF assumptions.
Other Images in This Article
Copyright and Terms & Conditions
© 2026. The Author(s). Published by the American Astronomical Society.

Copyright ©
2026 Astronomy Image Explorer. All Rights Reserved.
