

Image Details
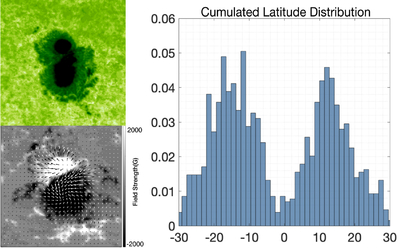
Caption: Figure 1.
Left: a sample vector magnetogram from HSOS (AR 6659, in the year 1991). The green color indicates the wavelength 5324 Å and shows a clear bipolar structure. The grayscale image depicts the magnetic field strength in gausses, with the black and white arrows marking the direction of the transverse magnetic field. Right: the latitude distribution of our total 1490 sample active regions, which appears as a slightly skewed normal distribution.
Other Images in This Article
Copyright and Terms & Conditions
© 2026. The Author(s). Published by the American Astronomical Society.

Copyright ©
2026 Astronomy Image Explorer. All Rights Reserved.
