

Image Details
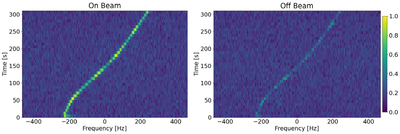
Caption: Figure 2.
An output plot from the ATSAT pipeline depicting two plots of a signal that was flagged for further investigation after visual inspection. The plotted signal corresponds to hit with a drift rate of 1.326 Hz s−1 and an SNR ratio of 5.45. The plots show frequency offset from a center frequency of 2400.014593 MHz, time on the y-axis, and normalized intensity (scaled to the brightest and faintest intensities in the leftmost panel) in the colorbar. The left panel is the dynamic spectrum of the “on-beam,” which was pointed toward LTT 3780, while the right panel shows the dynamic spectrum of the “off-beam,” which serves as the control. This event is definitively technological due to its narrowband nature, is either inherently changing frequency or Doppler drifting, and is fainter in the off-beam, indicating potential sky localization. This signal was determined to be RFI due to its varying SNR ratio displayed in Figure 3.
Other Images in This Article
Copyright and Terms & Conditions
© 2026. The Author(s). Published by the American Astronomical Society.

