

Image Details
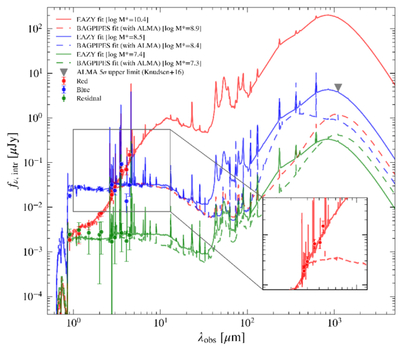
Caption: Figure 9.
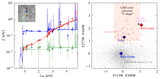
Spectral energy distributions of the decomposed red, blue, and residual components. Points show the measured JWST photometry. Solid curves show the EAZY fits, while dashed curves show the BAGPIPES fits including the ALMA upper limit from K. K. Knudsen et al. (2016, gray triangle). The blue and residual components are largely unaffected by the ALMA constraint, whereas the red component is driven toward lower stellar masses while failing to reproduce the reddest JWST fluxes, illustrating the tension between the JWST photometry and the ALMA nondetection under standard stellar population models.
Other Images in This Article
Copyright and Terms & Conditions
© 2026. The Author(s). Published by the American Astronomical Society.

Copyright ©
2026 Astronomy Image Explorer. All Rights Reserved.
