

Image Details
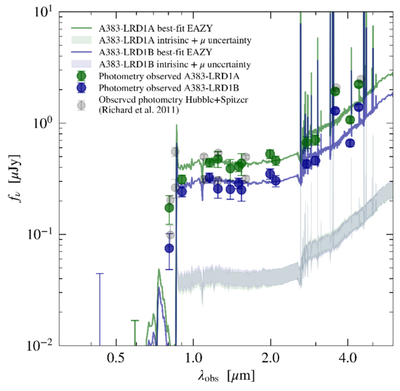
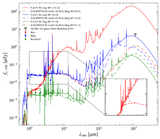
Caption: Figure 2.
Spectral energy distribution derived from our aperture photometry for A383-LRD1A (green points) and A383-LRD1B (blue points). The solid lines show the best-fit model to the total SED obtained with EAZY. The SED exhibits the characteristic “double-break” (or “V-shape”), corresponding to the Lyman and Balmer breaks, and its UV to optical colors are typical of the LRD population. Adopting the reported magnifications of μA = 11.4 ± 1.9 and μB = 7.3 ± 1.2 by J. Richard et al. (2011), we compute the intrinsic SED, with the uncertainties in μ represented by the shaded regions. The observed flux ratios (A383-LRD1A/A383-LRD1B) are in perfect agreement with the predicted μA/μB.
Other Images in This Article
Copyright and Terms & Conditions
© 2026. The Author(s). Published by the American Astronomical Society.

