

Image Details
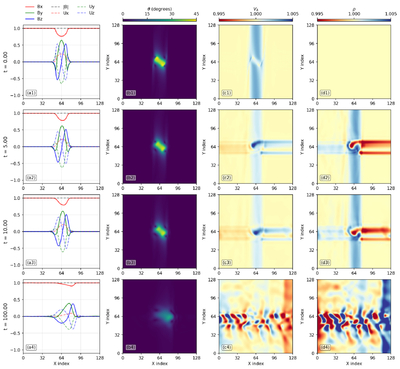
Caption: Figure 4.
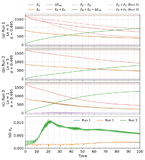
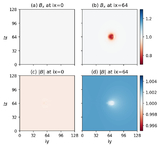
MHD simulation of the Alfvénon at t = 0.0, 5.0, 10.0, 100.0. Column (a) 1D profile at iy = 64 and iz = 64. Column (b) 2D X–Y slice of θ at iz = 64. Column (c) ﹩{V}_{{\rm{A}}}=| {\boldsymbol{B}}| /\sqrt{\rho }﹩. Column (d) ρ. Rows (1)–(4) correspond to times t = 0.0, 5.0, 10.0, and 100.0.
Other Images in This Article
Copyright and Terms & Conditions
© 2026. The Author(s). Published by the American Astronomical Society.

Copyright ©
2026 Astronomy Image Explorer. All Rights Reserved.
