

Image Details
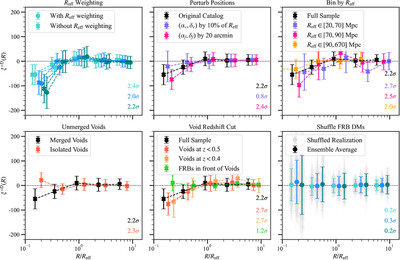
Caption: Figure 4.
Validation tests to assess the robustness of our measurement. All, except for the first and last few tests, are conducted using the FRB sample thesholded at 500 pc cm−3 for visual clarity. The upper-left panel shows the sensitivity of measurement to void size weighting used in our cross-correlation estimator; the Reff weighting impacts the measurement at the 0.2–0.4σ level. The upper-middle panel verifies the sensitivity of the measured signal to the positional uncertainty of FRBs and voids, where the uncertainty from the void center measurement may be a dominant systematic. The upper-right panel evaluates the contribution to observed signal from small and large voids; all void sizes are contributing to the signal, including the ones with sizes well beyond the mean tracer (BOSS galaxies) separation. The bottom-left panel compares the measured DM deficit to that obtained using a larger void catalog constructed from BOSS galaxies without merging smaller voids, in which case the underdensity vanishes, indicating the importance of merging smaller associated Voronoi cells in watershed algorithms. The bottom-middle panel compares the signal strength when redshift cuts are applied to ensure voids lie in front of the FRB sources; the signal remains persistent and consistent within the error bars and vanishes when FRBs are placed in front of the voids. The bottom-right panel tests the null hypothesis, where randomization of FRB DMs while fixing the void and FRB positions decorrelates the signal.
Other Images in This Article
Copyright and Terms & Conditions
© 2026. The Author(s). Published by the American Astronomical Society.

