

Image Details
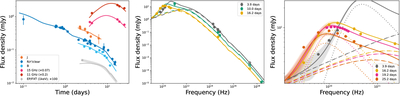
Caption: Figure 4.
Multiwavelength radio to X-ray light curves at ≈0.1–25 days (left), and spectral energy distributions (center; extrapolated Einstein Probe Follow-up X-ray Telescope points are shown as open symbols) with a zoom in to the radio (right) for GRB 260310A with an FS model in a wind environment including two episodes of energy injection (dominating in the optical and X-rays; dashed) and an RS in a structured jet (dominating at radio wavelengths; dotted, right panel). The shaded regions indicate the 1σ scatter expected from interstellar scintillation along this sight line.
Other Images in This Article
Copyright and Terms & Conditions
© 2026. The Author(s). Published by the American Astronomical Society.

Copyright ©
2026 Astronomy Image Explorer. All Rights Reserved.
