

Image Details
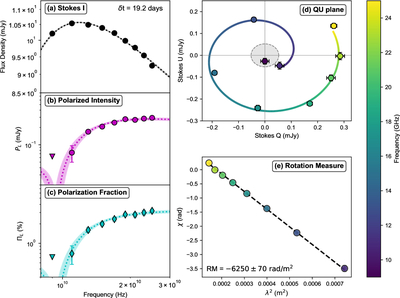
Caption: Figure 3.
(a) The measured flux density of Stokes I, (b) the linear polarization flux density, and (c) the linear polarization fraction ΠL as a function of frequency. We show the best-fitting model (Equation (B11); dotted lines, shaded regions are 1σ posteriors), which show a constant linear polarization intensity and fraction that decays exponentially to lower frequencies. (d) We show the Stokes U versus Q colorized by observed frequency. The data exhibit a spiral structure indicative of Faraday rotation. The solid line shows the depolarization frequency response derived from Equation (B11), and the shaded region indicates the average 3σ detection threshold for PL. (e) The polarization angle ﹩\chi =(1/2)\arctan (U/Q)﹩ as a function of λ2. The data reveal a steep slope corresponding to a rotation measure (RM) of ∣RM∣ ≈ 6.3 × 10³ rad m−2, indicative of a highly ordered magnetic field structure along the LOS.
Other Images in This Article
Copyright and Terms & Conditions
© 2026. The Author(s). Published by the American Astronomical Society.

