Image Details
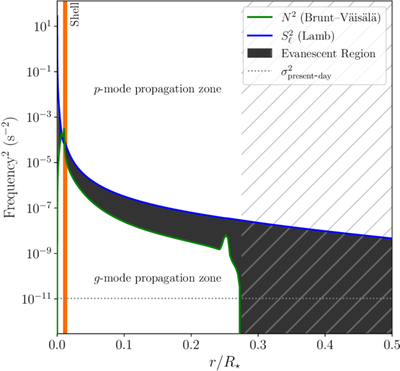
Caption: Figure 2.
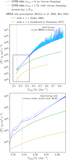
Propagation diagram for the primary TOI-5882 during its early RGB evolution. The green and blue solid curves show the radial profiles of the squared Brunt–Väisälä frequency and the ℓ = 2 Lamb frequency, respectively. The dark shaded region denotes the evanescent region, which separates the outer acoustic (p-mode) cavity from the deep interior gravity (g-mode) cavity. The hatched region represents the convective region of the star while the orange shaded region denotes the radial location of the hydrogen-burning shell. Lastly, the horizontal dotted line marks the present-day tidal forcing frequency induced by the BD companion.
Other Images in This Article
Copyright and Terms & Conditions
© 2026. The Author(s). Published by the American Astronomical Society.