Image Details
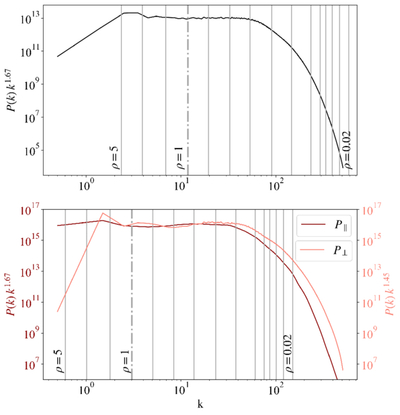
Caption: Figure 2.
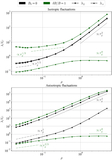
1D compensated power spectra for the isotropic (top panel) and anisotropic field (bottom panel). Vertical lines indicate the different values of gyroradius (i.e., different reduced rigidities) used to initialize the test particles.
Other Images in This Article
Copyright and Terms & Conditions
© 2026. The Author(s). Published by the American Astronomical Society.
Copyright ©
2026 Astronomy Image Explorer. All Rights Reserved.