Image Details
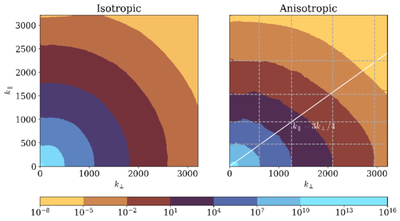
Caption: Figure 1.
2D power spectrum of the turbulent isotropic (left) and anisotropic (right) field. Black lines are isocontours of the spectrum, plotted at the same levels on both fields.
Other Images in This Article
Copyright and Terms & Conditions
© 2026. The Author(s). Published by the American Astronomical Society.
Copyright ©
2026 Astronomy Image Explorer. All Rights Reserved.