Image Details
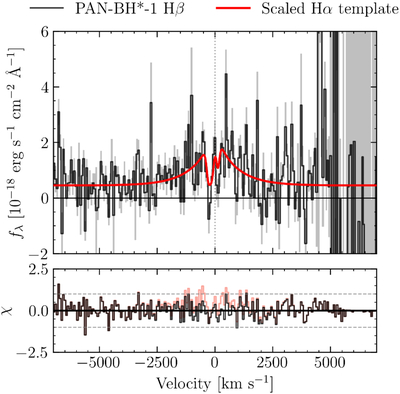
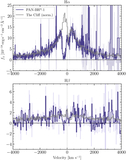
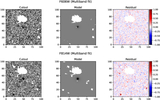
Caption: Figure 5.
Hβ spectrum. The spectrum is rebinned by a factor of 10 with inverse variance flux weighting for visual clarity, due to the low S/N. We compare to the best-fit Hα model, scaled by a factor of 0.112. In the bottom panel, we show the χ residuals between the spectrum and the rescaled Hα model in black, and for only the continuum in pink (ΔBIC = 121 strongly favoring the presence of a broad Hβ line).
Other Images in This Article
Copyright and Terms & Conditions
© 2026. The Author(s). Published by the American Astronomical Society.
Copyright ©
2026 Astronomy Image Explorer. All Rights Reserved.