Image Details
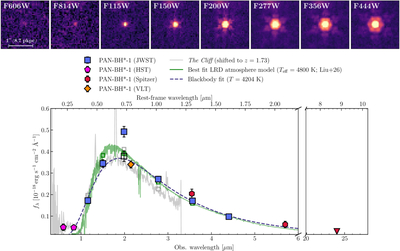
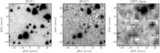
Caption: Figure 1.
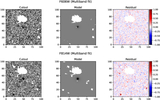
SED of PAN-BH*-1 Top: cutouts from all the HST and JWST images in which PAN-BH*-1 is covered. It shows a remarkably compact morphology in all the wavelengths, resolved only in the HST F606W and F814W bands (Section 3.3). Bottom: photometry from JWST/NIRCam (blue squares), HST/ACS (purple pentagons), and Spitzer/IRAC+MIPS (red hexagons, and red triangle for the 5σ upper limit). The empty square is the F200W flux after subtracting the Hα flux measured from X-Shooter spectroscopy. We show the spectrum of The Cliff for comparison (gray line), shifted to z = 1.73 and normalized to the F150W flux of PAN-BH*-1. We also show the best-fitting blackbody spectrum (blue dashed line) and the best model from the synthetic LRD atmosphere models from H. Liu et al. (2026), shifted to z = 1.73 (green line), undersampled by a factor of 500 for clarity.
Other Images in This Article
Copyright and Terms & Conditions
© 2026. The Author(s). Published by the American Astronomical Society.