Image Details
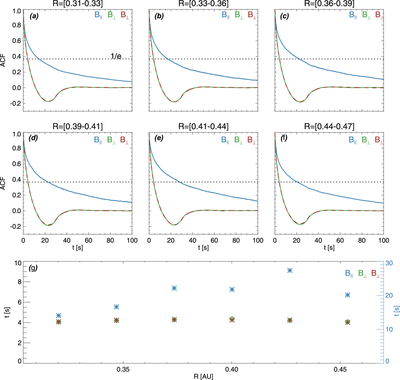
Caption: Figure 4.
Radial dependence of autocorrelation properties and characteristic timescales of magnetic field fluctuations near Mercury’s orbit. (a)–(f) show the autocorrelation functions (ACFs) of magnetic field fluctuations for six heliocentric distance ranges from 0.31 to 0.47 au. The horizontal dashed line indicates the 1/e level used to define the correlation time. Blue curves denote fluctuations parallel to the background magnetic field, while red and green curves denote the two perpendicular components. (g) summarizes the correlation times as functions of heliocentric distance. The perpendicular components (red asterisks and green diamonds) are plotted against the left axis, whereas the parallel component (blue asterisks), which has a much larger correlation time, is plotted against the right axis.
Other Images in This Article
Copyright and Terms & Conditions
© 2026. The Author(s). Published by the American Astronomical Society.