Image Details
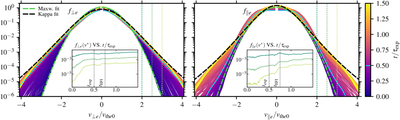
Caption: Figure 4.
Time evolution of the perpendicular (fe(v⊥e)) and parallel (fe(v∥e)) electron VDFs. The dashed green line corresponds to a Maxwellian fit at t = 0, while the dashed black line corresponds to a Kappa distribution fit (e.g., C. S. Salem et al. 2023) at ﹩t=1.5{\tau }_{{\rm{\exp }}}﹩ with parameter κ = 6.2 for fe(v⊥e) and κ = 5 for fe(v∥e). The solid blue line indicates the electron VDF at ﹩t=0.5{\tau }_{{\rm{\exp }}}﹩ (onset time of expansion). The insets show the time evolution of the electron VDF at a fixed speed v* = {2.0, 2.5, 3.0}vthe0 associated with the vertical dashed lines displayed in their respective main panel.
Other Images in This Article
Copyright and Terms & Conditions
© 2026. The Author(s). Published by the American Astronomical Society.