Image Details
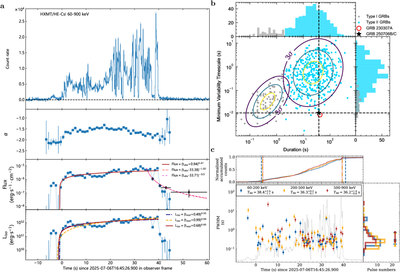
Caption: Figure 1.
The light curve of GRB 250706B/C. (a) The time-resolved spectra and the peak-finding result. (b) The GRB 250706B/C in the T90–MVT diagram. (c) The pulse width of GRB 250706B/C in three different energy ranges (i.e., 60–200 keV, 200–500 keV, and 500–900 keV) as well as the duration of the emission in these three energy ranges. There is no significant broadening or narrowing of both the subpulses and the overall prompt emission as a function of photon energy, suggesting a central-engine-dominated emission process rather than a dissipation-dominated emission process.
Other Images in This Article
Copyright and Terms & Conditions
© 2026. The Author(s). Published by the American Astronomical Society.
Copyright ©
2026 Astronomy Image Explorer. All Rights Reserved.