Image Details
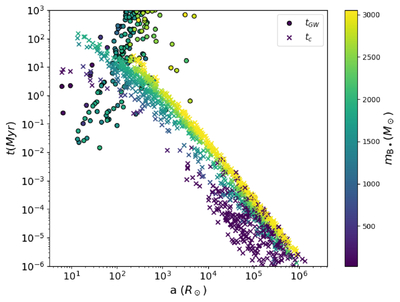
Caption: Figure 3.
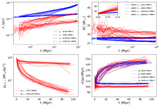
The relationship between the semimajor axis a and evolution timescales for BBH mergers in the M50k-IMF-All-r0.01 model. tGW, represented by dots, denotes the GW merger timescale, while tc, shown as crosses, denotes the collisional (close-encounter) timescale.
Other Images in This Article
Copyright and Terms & Conditions
© 2026. The Author(s). Published by the American Astronomical Society.
Copyright ©
2026 Astronomy Image Explorer. All Rights Reserved.