Image Details
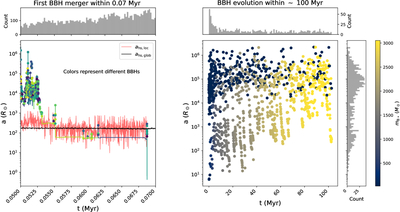
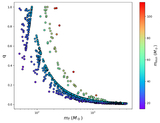
Caption: Figure 2.
Semimajor axis (a) of BBHs as a function of time t for the M50k-IMF-All-r0.01 model. The left panel adopts a sampling interval of 2 × 10⁻⁷ Myr, revealing the detailed early evolution of the system between 0.05 and 0.07 Myr. The lines with points denote the various transient BBHs that appear throughout the evolutionary history of a particular hard BBH that merges at 0.06874 Myr. ahs,glob and ahs,loc denote the hard–soft binary boundaries for the global and local regions, respectively. The histograms at the top represent the number of distinct BBHs in each time bin (2 × 10⁻⁷ Myr). The right panel employs a sampling interval of 0.01 Myr, revealing BBH evolution within ∼100 Myr, with the color of each point indicating the total mass of the BBH system (MBBH). The histograms at the top and right represent the number of distinct BBHs in each time bin (0.01 Myr) and the marginal distribution of BBHs along the semimajor axis a, respectively.
Other Images in This Article
Copyright and Terms & Conditions
© 2026. The Author(s). Published by the American Astronomical Society.