Image Details
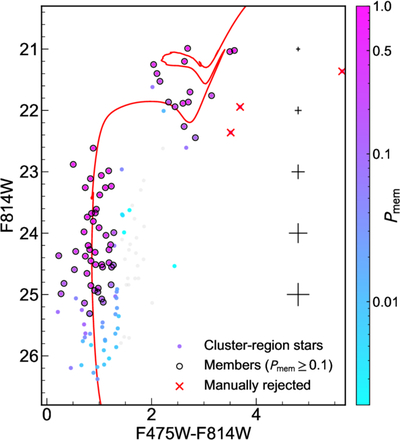
Caption: Figure 3.
Color–magnitude diagram of AP 210. Stars within the cluster aperture are color-coded by their empirical retention fraction (Pmem), with stars of Pmem = 0 shown in light gray. Black open circles mark stars with Pmem > 0.1 retained for the isochrone fitting, while red crosses indicate outliers excluded by visual inspection. The red curve shows the best-fitting MIST isochrone, with ﹩\mathrm{log}({\rm{Age}}/{\rm{yr}})=7.95﹩, E(B − V) = 0.57 mag, and [Fe/H] = 0.06. Representative photometric uncertainties as a function of magnitude are shown on the right.
Other Images in This Article
Copyright and Terms & Conditions
© 2026. The Author(s). Published by the American Astronomical Society.
Copyright ©
2026 Astronomy Image Explorer. All Rights Reserved.