Image Details
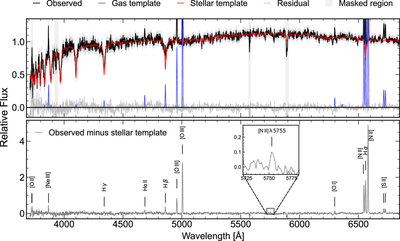
Caption: Figure 2.
Top panel: observed spectrum (black), best-fit stellar spectrum (red), and best-fit nebular-emission model (blue) from the pPXF fit. The fit residuals are shown in gray, and masked regions are indicated by gray shading. Bottom panel: residual nebular spectrum obtained by subtracting the best-fit stellar spectrum from the observed spectrum. Key nebular emission lines used in the subsequent analysis are labeled.
Other Images in This Article
Copyright and Terms & Conditions
© 2026. The Author(s). Published by the American Astronomical Society.
Copyright ©
2026 Astronomy Image Explorer. All Rights Reserved.