Image Details
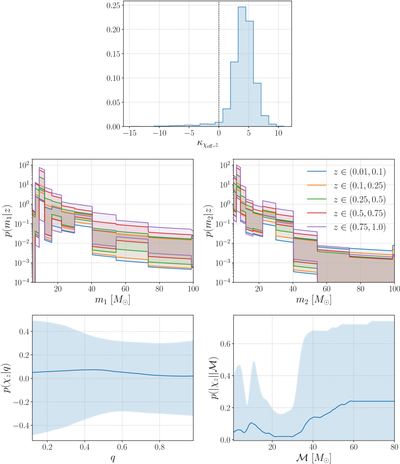
Caption: Figure 22.
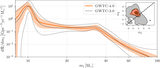
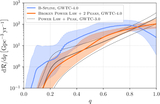
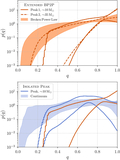
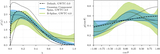
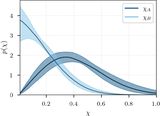
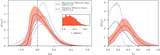
Top: posterior distributions for the level of correlation between redshift and effective inspiral spin ﹩{\kappa }_{{\chi }_{{{\rm{eff}}}},z}﹩ inferred using the COPULA model. The vertical black dashed line in each plot indicates a value of ﹩{\kappa }_{{\chi }_{{{\rm{eff}}}},z}﹩, at which no correlation is implied. Middle: inferred distributions of primary mass (left) and secondary mass (right) in the redshift and spin correlated BGP analysis. The solid lines bound the 90% credible intervals for each redshift bin. We can see that all redshift bins from z = 0.01 to z = 1 are consistent within 90% credibility. Bottom: correlated mass and spin PPDs from the FM model. Solid lines give the medians, while the shaded regions encompass 90% of the PPD volume. The left panel gives the inferred distribution of aligned spin χz given mass ratio. We do not see any evidence for or against a correlation. The right panel gives the inferred distribution of the aligned spin magnitude ∣χz∣ as a function of chirp mass. We see that the uncertainty is very large, with a notable drop in the ∼20 − 30 M⊙ region. For reference, this region very roughly corresponds to the 30 M⊙ peak observed in the component mass distributions (a 30 M⊙ + 30 M⊙ BBH has a chirp mass of ﹩{ \mathcal M }\approx 26\,{M}_{\odot }﹩). Following the mass- and spin-correlated BGP results then, it is unsurprising that the FM results prefer a local minimum in aligned spin magnitude in this region.
Other Images in This Article
Show More
Copyright and Terms & Conditions
© 2026. The Author(s). Published by the American Astronomical Society.