Image Details
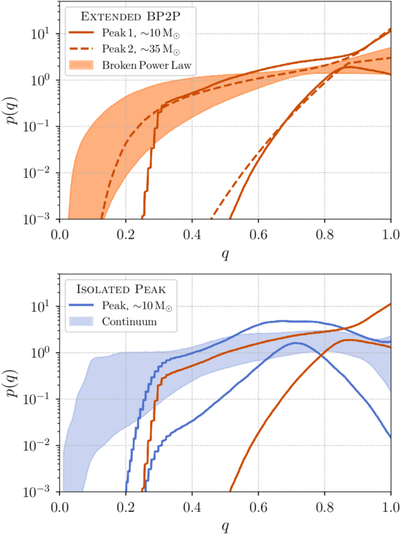
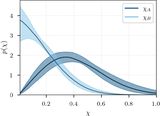
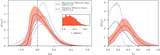
Caption: Figure 6.
Top panel: the 90% credible regions for the mass-ratio distribution of the ∼10 M⊙ peak (solid orange curves), ∼35 M⊙ peak (dashed curves), and continuum (orange shaded region) components of the EXTENDED BROKEN POWER LAW + 2 PEAKS model. Bottom panel: the 90% credible regions for mass-ratio distribution of the ∼10 M⊙ peak (solid blue curves) and the rest of the mass spectrum (blue shaded region) inferred with the ISOLATED PEAK model. The ∼10 M⊙ peak mass-ratio distribution from the EXTENDED BROKEN POWER LAW + 2 PEAKS is included for comparison.
Other Images in This Article
Show More
Copyright and Terms & Conditions
© 2026. The Author(s). Published by the American Astronomical Society.
Copyright ©
2026 Astronomy Image Explorer. All Rights Reserved.