Image Details
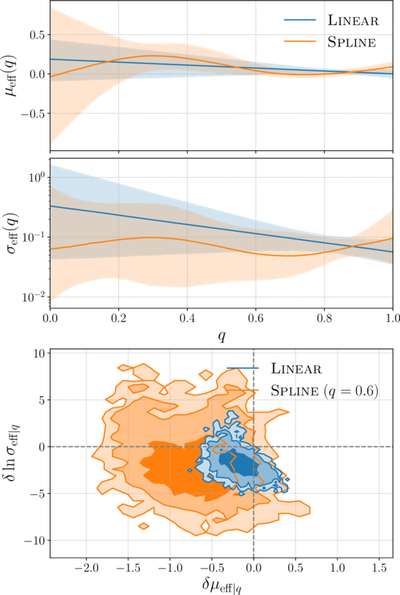
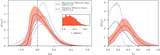
Caption: Figure 11.
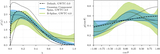
The inferred peak (top) and width (middle) of the χeff distribution as a function of mass ratio for the (q, χeff) LINEAR model (blue) and SPLINE model (orange). The shaded regions in these panels give the 90% credible intervals. The bottom panel gives the posterior distribution for the gradient of the χeff distribution’s peak (δμeff∣q) and natural log width (﹩\delta {\mathrm{ln}}{\sigma }_{{{\rm{eff}}}| q}﹩) dependent on mass ratio. From dark to light, the shaded regions represent the 50%, 90%, and 99% credible intervals. Again, blue gives the result of the LINEAR model, while orange shows the result of the SPLINE model sliced through q = 0.6 (the approximate point at which the gradients are largest). It appears that mass ratio and χeff exhibit some kind of correlation, but the exact nature is unclear.
Other Images in This Article
Show More
Copyright and Terms & Conditions
© 2026. The Author(s). Published by the American Astronomical Society.