Image Details
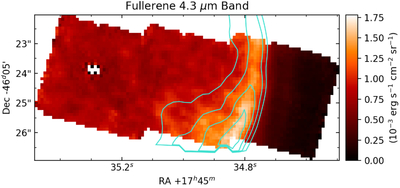
Caption: Figure 3.
Integrated surface brightness map of the 4.3 μm band. The white patch near the central star indicates pixels affected by diffraction and fringing artifacts. Blue contours show the C60 17.4 μm emission from Giese et al. (2026, in preparation), demonstrating that the near-IR and mid-IR fullerene emission trace the same spatial distribution.
Other Images in This Article
Copyright and Terms & Conditions
© 2026. The Author(s). Published by the American Astronomical Society.
Copyright ©
2026 Astronomy Image Explorer. All Rights Reserved.