Image Details
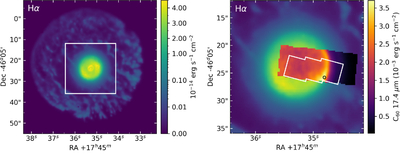
Caption: Figure 1.
Hα maps of Tc 1 from VLT/MUSE observations (J. R. Walsh et al. 2026) showing the bright central nebula and surrounding halo. The right panel shows a close-up of the central region indicated by the white box in the left panel, with the C60 17.4 μm surface brightness map from the MIRI observations (M. M. Giese et al. 2026, in preparation) overlaid, revealing the fullerene emission ring. The white box in the right-hand panel indicates the footprint of the NIRSpec data discussed in this Letter. The black circle corresponds to the location of the spectrum shown in Figure 2.
Other Images in This Article
Copyright and Terms & Conditions
© 2026. The Author(s). Published by the American Astronomical Society.
Copyright ©
2026 Astronomy Image Explorer. All Rights Reserved.