Image Details
Caption: Figure 3.
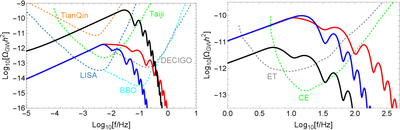
GW signals (solid lines) versus experimental sensitivity curves as a function of f (dashed lines). Left panel: GW spectrum in the frequency band 10−5–1 Hz, with the sensitivity curve of Taiji (green), TianQin (orange), LISA (light blue), BBO (cyan), and DECIGO (gray). Right panel: GW spectrum in the frequency band 1–103 Hz, with the sensitivity curve of CE (green) and ET (gray). The GW signals are evaluated with wc = 1.2, wrh = 0 so the spectra index is ﹩{n}_{{\rm{IM}}}=0.87﹩ at intermediate regimes ﹩f\,\leqslant \,{f}_{{\rm{IM}}}﹩. This is different from the scalar-induced GWs in inflation (G. Domènech 2021), where the spectrum has a log-dependence slope ﹩{n}_{{\rm{GW}}}(f)=3-2\mathrm{ln}(f/{f}_{c})﹩ in the IR regime f ≪ fc (C. Yuan et al. 2020).
Other Images in This Article
Copyright and Terms & Conditions
© 2026. The Author(s). Published by the American Astronomical Society.