Image Details
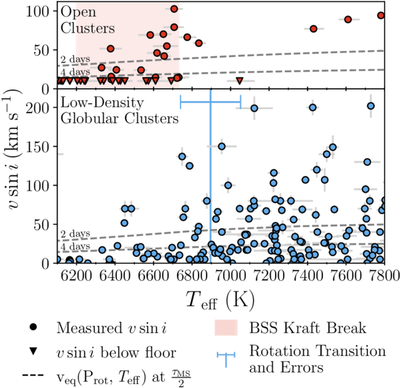
Caption: Figure 4.
We show the Teff–﹩v\sin i﹩ distribution of BSSs in open clusters (upper panel, in red, from Figure 2) and low-density globular clusters (lower panel, in blue). Like in Figure 3, using MIST evolutionary tracks, we calculated the equatorial velocity for stars that are halfway through their main-sequence lifetimes at a specific Teff with rotational periods of 2 and 4 days, and plot these with dashed lines. We further show the BSS Kraft break at solar metallicity (red area) in the upper panel and the best-fit Teff with errors (blue line) that demarcates a transition of the globular cluster BSS rotation distribution in the lower panel.
Other Images in This Article
Copyright and Terms & Conditions
© 2026. The Author(s). Published by the American Astronomical Society.