Image Details
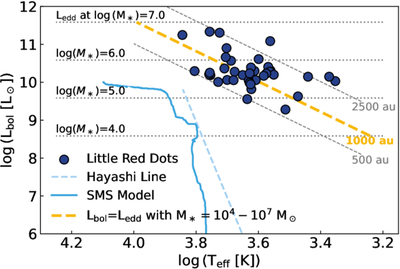
Caption: Figure 2.
Comparison of the effective temperature (Teff) and the bolometric luminosity (Lbol) as measured from modified blackbody fits to a sample of LRDs (blue point; A. de Graaff et al. 2025a). The solid light-blue line illustrates a model for the evolution of an accreting supermassive star in hydrostatic equilibrium (D. Nandal & A. Loeb 2026). The SMS model is significantly cooler and less luminous than the LRDs, possibly because it does not account for a dense wind (Section 2.1). The blue dashed line shows the Hayashi Line, or the maximum luminosity of a fully convective star in hydrostatic equilibrium. In dashed gray, we show lines of constant radius (500 and 2500 au), while the dotted gray horizontal lines show the Eddington Luminosity of an object with ﹩\mathrm{log}(﹩M*/M⊙) = 4, 5, 6, and 7. The gold-dashed line shows the Eddington Luminosity for a 1000 au object with mass increasing from 104 to 107 M⊙. The LRD population is consistent with a 104−7 M⊙ star emitting at, or above, the Eddington Luminosity.
Other Images in This Article
Copyright and Terms & Conditions
© 2026. The Author(s). Published by the American Astronomical Society.