Image Details
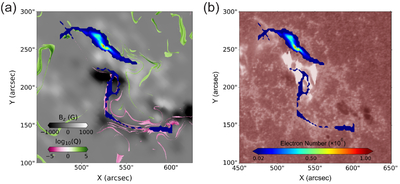
Caption: Figure 3.
Distribution of 10 s accumulated precipitating electrons mapped to the magnetogram at the bottom boundary and compared with the photospheric QSLs (a) and overlaid on the observed AIA 1700 Å image at 03:52 UT (b).
Other Images in This Article
Copyright and Terms & Conditions
© 2026. The Author(s). Published by the American Astronomical Society.
Copyright ©
2026 Astronomy Image Explorer. All Rights Reserved.