

Image Details
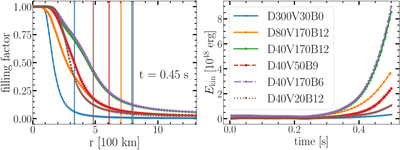
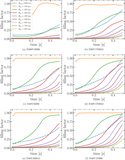
Caption: Figure 5.
Left: filling factor as a function of radius of our simulations at t = 0.45 s. The vertical lines denote the distance of the deflagration front from the center. Right: kinetic energy as a function of time.
Other Images in This Article
Copyright and Terms & Conditions
© 2026. The Author(s). Published by the American Astronomical Society.

Copyright ©
2026 Astronomy Image Explorer. All Rights Reserved.
