Image Details
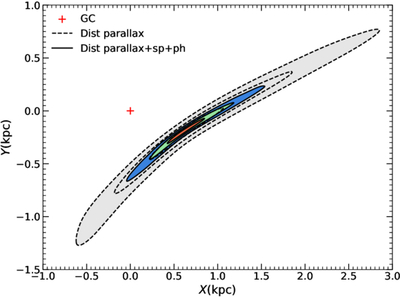
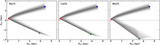
Caption: Figure 5.
The contours show the intersection regions of the backward-integrated orbits with the Galactic disk midplane in the X–Y-plane for the first crossing. The gray region is derived using the parallax-based distance, while the colored region is derived using the improved distance from isochrone fitting constrained by photometric and spectroscopic measurements. The dashed lines for the parallax-based distance and the black solid lines for the improved distance from isochrone fitting mark the 16th, 50th, and 84th percentiles (from inner to outer) of the plane-crossing distribution, corresponding to the 1σ interval around the median.
Other Images in This Article
Copyright and Terms & Conditions
© 2026. The Author(s). Published by the American Astronomical Society.